
Dynamic QR Platform
Create QR codes Instantly
Website URL
Send users to any webpage
Website URL
Website URL
Send users to any webpage
Wi-Fi
Let users connect instantly
Wi-Fi
Wi-Fi
Let users connect instantly
Menu
Create a digital menu
Menu
Menu
Create a digital menu
Start a chat with one tap
Start a chat with one tap
Image
Showcase visuals
Image
Image
Showcase visuals
Show a downloadable file
Show a downloadable file
14 Sep 2026 • 15 min read
How to Track QR Code Campaign ROI From Flyers, Direct Mail, Posters, and Packaging
A practical measurement framework for tracking QR code campaign ROI across flyers, direct mail, storefront posters, and package inserts—from scans through leads, sales, and incremental lift.
IntroductionStart with an outcome, not a QR codeBuild a campaign measurement map before print productionUse a unique dynamic QR code for every meaningful variableCreate a campaign naming convention people can actually followAdd UTM parameters to preserve campaign detail after the scanChoose destinations that match the printed promiseEstablish baselines before you compare resultsTrack conversion events from the landing page to the final resultCalculate the four core QR campaign metricsWorked example: four offline formats, one promotionMeasure incremental performance, not only credited conversionsSet expiration and update policies before launchUse a recurring reporting templateKnow the attribution limitsImprove data quality with operational disciplineMake offline ROI a repeatable systemFAQ
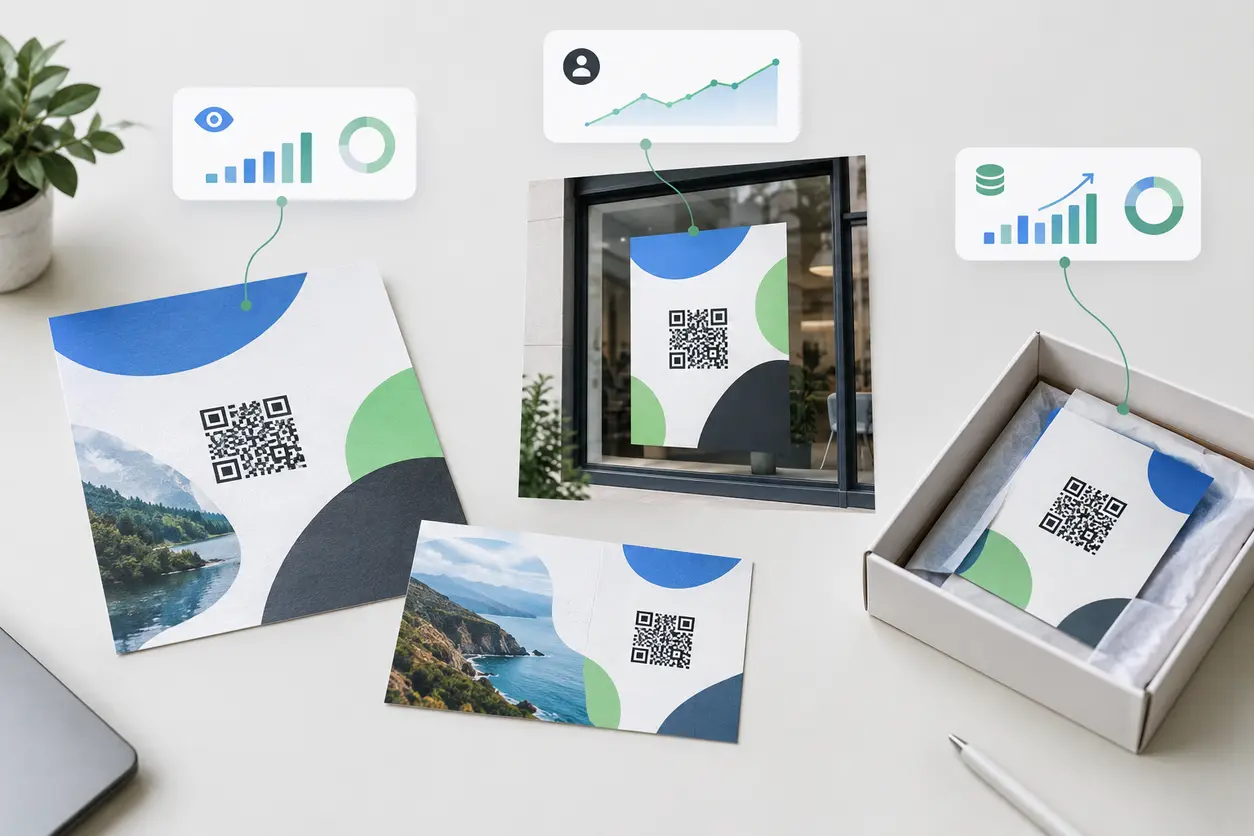
Effective QR code campaign tracking connects four stages:
- The physical exposure: a flyer delivered, postcard mailed, poster displayed, or package insert packed.
- The scan: someone opens the QR destination.
- The conversion: that visitor submits a form, books, redeems, purchases, calls, or completes another defined action.
- The business outcome: the lead or sale is connected to cost, revenue, margin, or a meaningful next step.
This guide provides a practical system for small-business marketers, agencies, franchise teams, and print campaign managers. The objective is not to make every printed item complicated. It is to create enough structure to answer a useful question: which offline campaign investment produced the most valuable outcome?
Start with an outcome, not a QR code
Before creating codes, define what success means for this campaign. “More scans” may be a useful diagnostic metric, but it is rarely the final business goal.
Choose one primary conversion event for each campaign:
- Lead form submitted
- Quote or consultation requested
- Appointment booked
- Coupon redeemed
- Ecommerce order completed
- Store offer claimed
- Product registration QR code completed
- Repeat order started
- Phone call initiated from the landing page
Then select secondary events that explain where visitors drop off. For a service company, those might be landing-page views, quote form starts, quote form completions, and booked appointments. For a retailer, they might be scans, offer-page views, add-to-cart events, purchases, and coupon redemptions.
A clear primary event prevents a common reporting problem: a high-scan poster appears successful even though it produces few leads or sales.
Build a campaign measurement map before print production
Treat every QR code as a trackable campaign asset with a defined owner, destination, audience, and conversion goal. Create a campaign record before files go to print.
For each code, document:
- Campaign name and campaign period
- Physical channel: flyer, direct-mail postcard, poster, or package insert
- Specific location or distribution area
- Creative version and offer
- Intended audience or segment
- Destination URL and UTM parameters
- QR code owner
- Print quantity or estimated impressions
- Production and distribution cost
- Primary conversion event
- Expiration date, review date, and contingency destination
This record is the link between a physical object and your analytics report. Without it, teams often discover scans later but cannot tell which version, neighborhood, store, or promotion drove them.
Use a unique dynamic QR code for every meaningful variable
For ROI measurement, use a unique dynamic QR code whenever you need to compare performance. A dynamic code routes through an editable destination, so the printed symbol can remain in circulation while the final URL or campaign experience is updated.
In QR Rapid, create separate dynamic QR codes rather than reusing one code across all print pieces. The physical design can look consistent while each code is assigned its own campaign identity and destination.
The most useful dimensions to separate are below.
Channel
Create one code per print channel. Do not use the same code for flyers, postcards, posters, and inserts.
Example identifiers:
- SPRING26_FLYER
- SPRING26_DM
- SPRING26_POSTER
- SPRING26_INSERT
This answers the fundamental question: which offline channel generated the most scans, conversions, and revenue?
Location
When location affects the decision, create a code for each store, neighborhood, event, branch, or distribution zone.
Examples:
- SPRING26_POSTER_DOWNTOWN
- SPRING26_POSTER_NORTHSIDE
- SPRING26_FLYER_ZONE_A
- SPRING26_FLYER_ZONE_B
For franchise teams, this structure makes it possible to compare local activation without mixing all locations into a single scan count.
Creative version
If you are testing a headline, offer, image, call to action, or format, each version needs a distinct code. Otherwise, the creative test is not measurable.
Example:
- SPRING26_DM_A_FREEASSESSMENT
- SPRING26_DM_B_20PCTOFF
Keep the audience and distribution method as similar as possible when comparing creative. A code alone cannot correct for a postcard version that was sent to a different customer segment.
Audience or audience segment
Use separate codes for customer groups with meaningfully different expected behavior, such as prospects versus prior buyers, or residential versus commercial recipients.
Example:
- SPRING26_DM_PROSPECTS
- SPRING26_DM_LAPSEDCUSTOMERS
Do not put personally identifiable information inside QR code names or URLs. Use a segment label that is meaningful to your team without exposing individual data.
Create a campaign naming convention people can actually follow
A naming convention must be detailed enough to support reporting and short enough that staff will use it consistently. A predictable format also makes it easier to find, update, and retire QR codes months after a campaign launches.
A practical pattern is:
[campaign]_[channel]_[location]_[audience]_[creative]_[month-year]
For example:
SUMMER_OFFER_DM_WEST_PROSPECT_A_0626
Use controlled values for repeated fields:
- Channel: FLYER, DM, POSTER, INSERT
- Location: store code, territory, zip cluster, or ALL
- Audience: PROSPECT, CUSTOMER, LAPSED, MEMBER
- Creative: A, B, CONTROL
Avoid vague labels such as new code final or mailer latest. Those labels make historical reporting unreliable and create risk when a team member needs to change a destination quickly.
Add UTM parameters to preserve campaign detail after the scan
QR platform analytics can show scan activity, while UTM parameters carry campaign context into your website analytics, CRM-connected forms, ecommerce platform, or advertising tools.
A destination URL can include parameters such as:
https://example.com/summer-offer?utm_source=qr&utm_medium=direct_mail&utm_campaign=summer_offer_2026&utm_content=west_prospect_a
Use a consistent UTM structure:
- utm_source=qr identifies QR-driven traffic.
- utm_medium= identifies the physical format, such as flyer, direct_mail, poster, or package_insert.
- utm_campaign= identifies the broader promotion and period.
- utm_content= distinguishes location, audience, creative, or distribution batch.
Keep values lowercase, readable, and standardized. Decide whether you will use direct_mail or mail before launch; do not switch midway through the campaign.
Do not rely on UTMs alone. A UTM labels website sessions, but it does not confirm that a printed code is still active, distinguish every physical placement unless the URL is unique, or provide an operational inventory of deployed codes. Pair UTMs with a QR code register and dynamic-code scan reporting.
Choose destinations that match the printed promise
A QR code should lead to the shortest credible path to the campaign’s primary conversion. Sending every scan to a homepage makes attribution and conversion analysis weaker because visitors must find the offer again.
Match the destination to intent:
- Flyer: a localized service offer, event registration page, or short quote-request page.
- Direct-mail postcard: a personalized-feeling landing page that repeats the postal offer and highlights a deadline or redemption instructions.
- Storefront poster: a mobile-first page for a nearby purchase, booking, waitlist, or current promotion.
- Package insert: a post-purchase page for activation, reorder, registration, product education, referral, or complementary items.
The landing page should repeat the offer, product, or benefit shown in print. This message match reassures scanners that they reached the expected destination and makes conversion behavior easier to interpret.
For campaigns with high intent, reduce fields and clicks. If a customer scans a poster to claim a same-day offer, a long multi-step form introduces friction that may be mistaken for poor poster performance.
Establish baselines before you compare results
A campaign has no meaningful “lift” if there is no reference point. Before launch, capture a baseline for the business outcome you expect to influence.
Useful baselines include:
- Average weekly leads from the target territory
- Typical appointment bookings for each participating location
- Sales of the promoted product before the insert campaign
- Existing conversion rate for the destination page
- Normal coupon redemptions or promo-code use
- Prior campaign performance using the same audience and offer
Write down the baseline period, source system, and method. For example: “Average weekly consultation requests from the West territory during the four weeks before the campaign, excluding paid search leads.”
A baseline is not proof that every additional conversion came from the QR code. It is a comparison point that helps identify whether performance moved beyond normal activity.
Track conversion events from the landing page to the final result
Scan data measures interest at the moment of handoff. To calculate ROI, also track the actions after the scan.
Configure your website, form, booking tool, or ecommerce platform to record the selected conversion event. Where possible, pass UTM values into the form or CRM as hidden fields so the lead record retains the original channel and creative details.
For a QR code lead capture campaign, the tracking chain could look like this:
- A QR Rapid code is scanned from a specific postcard.
- The destination opens with campaign-specific UTMs.
- The visitor submits the quote form.
- The CRM stores the lead and campaign fields.
- Sales marks the lead qualified, booked, won, or lost.
- Reporting ties revenue back to the original campaign code or UTM combination.
For physical or offline sales, establish a redemption mechanism. Use a campaign-specific promo code, a short form confirmation, a barcode at checkout, or a staff-visible offer identifier. If a customer scans but buys in-store later with no identifying action, the QR scan can indicate engagement but cannot reliably prove the sale.
Calculate the four core QR campaign metrics
Use the same definitions across channels so results are comparable.
1. Scan rate
Scan rate estimates how often people who received or could reasonably see the asset scanned it.
Scan rate = unique scans / distribution count × 100
Use the best available denominator:
- Flyers: number handed out or delivered
- Direct mail: number delivered or mailed, with any known undeliverable adjustment
- Posters: estimated opportunities to see, if a defensible count exists
- Package inserts: number of orders or units containing the insert
For posters, foot traffic is an estimate, not a delivery count. Label it accordingly and avoid presenting scan rate as precise when exposure cannot be measured well.
2. Conversion rate after scan
This shows how effectively the post-scan experience turns scanners into the chosen action.
Conversion rate = conversions / unique scans × 100
Calculate both a primary conversion rate and, if helpful, an intermediate conversion rate such as form starts per scan.
3. Cost per lead or sale
Include all attributable campaign costs: design revisions, printing, postage, insertion fees, distribution, paid placement, and any campaign-specific landing-page work.
Cost per lead = total campaign cost / leads
Cost per sale = total campaign cost / completed sales
Use qualified leads rather than raw form submissions when the business cares about sales quality. Report both if the difference matters.
4. ROI
When you can attribute revenue, use a simple return calculation:
ROI = (attributable revenue - total campaign cost) / total campaign cost × 100
If margins vary materially, substitute gross profit for revenue. If revenue is not yet available because of a long sales cycle, report cost per qualified lead, pipeline value, and conversion progression rather than declaring final ROI too early.
Worked example: four offline formats, one promotion
The following numbers are hypothetical examples, not benchmarks. A home-services business runs the same seasonal inspection offer through four channels. Each channel uses its own QR Rapid dynamic code, UTM medium, landing-page variant, and tracked form completion.
Flyer distribution
- 2,000 flyers delivered in a neighborhood
- 70 unique scans
- 14 quote requests
- 5 completed sales
- $900 total print and distribution cost
- $1,750 in attributable sales revenue
Calculations:
- Scan rate: 70 / 2,000 × 100 = 3.5%
- Scan-to-lead conversion rate: 14 / 70 × 100 = 20%
- Cost per lead: $900 / 14 = $64.29
- Cost per sale: $900 / 5 = $180
- ROI: ($1,750 - $900) / $900 × 100 = 94.4%
Direct-mail postcard
- 1,500 postcards mailed
- 90 unique scans
- 27 quote requests
- 9 completed sales
- $1,800 total design, print, postage, and mailing cost
- $3,150 in attributable sales revenue
Calculations:
- Scan rate: 90 / 1,500 × 100 = 6%
- Scan-to-lead conversion rate: 27 / 90 × 100 = 30%
- Cost per lead: $1,800 / 27 = $66.67
- Cost per sale: $1,800 / 9 = $200
- ROI: ($3,150 - $1,800) / $1,800 × 100 = 75%
The postcard creates more total sales than flyers, but its cost per sale is higher in this example. That distinction helps a marketer decide whether the priority is scale, efficiency, or a different audience outcome.
Storefront poster
- An estimated 4,000 passersby during the campaign
- 80 unique scans
- 12 quote requests
- 4 completed sales
- $250 design and print cost
- $1,400 in attributable sales revenue
Calculations:
- Estimated scan rate: 80 / 4,000 × 100 = 2%
- Scan-to-lead conversion rate: 12 / 80 × 100 = 15%
- Cost per lead: $250 / 12 = $20.83
- Cost per sale: $250 / 4 = $62.50
- ROI: ($1,400 - $250) / $250 × 100 = 460%
The poster has a lower scan rate but a much lower cost per sale because its production cost is small. Its exposure estimate should be treated cautiously, yet its cost and conversion data can still make it a strong candidate for continued testing.
Package insert
- 1,000 orders shipped with an insert
- 50 unique scans
- 15 follow-up offer redemptions
- 12 completed repeat purchases
- $180 printing and insertion cost
- $960 in attributable repeat-purchase revenue
Calculations:
- Scan rate: 50 / 1,000 × 100 = 5%
- Scan-to-purchase conversion rate: 12 / 50 × 100 = 24%
- Cost per sale: $180 / 12 = $15
- ROI: ($960 - $180) / $180 × 100 = 433.3%
The insert reaches customers after an initial purchase, so it should not be compared directly with prospecting mail on scan rate alone. Its purpose is post-purchase value, which is why repeat purchases and incremental revenue are the more relevant outcomes.
Measure incremental performance, not only credited conversions
Attributed QR conversions are valuable, but they can undercount people who scan, leave, and return later through another route. They can also overstate incremental impact if people who were already likely to buy use the QR code as a convenient path.
To improve the assessment, compare campaign areas, groups, or time periods against a sensible control when feasible.
Examples:
- Mail the offer to one matched neighborhood and hold out another similar neighborhood.
- Use a QR-coded insert in half of eligible shipments and compare reorder behavior with the non-insert group.
- Rotate two poster versions across comparable locations and dates.
- Compare participating franchise locations with a matched set not running the print asset.
The question becomes: did the exposed group produce more of the desired outcome than a comparable unexposed group? This is more informative than simply counting QR-coded transactions.
Keep the test simple. Change one major variable at a time and avoid declaring a winner if distribution conditions, offer availability, staffing, or seasonality changed at the same time.
Set expiration and update policies before launch
Printed assets can remain visible long after a promotion ends. Set an explicit policy for every dynamic QR code so customers do not land on an expired offer or a dead page.
A practical policy includes:
- Launch check: scan the final printed proof from more than one mobile device before approving production.
- Review date: schedule a destination and analytics review during the campaign.
- Expiration date: define when the offer is no longer valid.
- Post-expiration destination: redirect to a current offer, evergreen category page, store locator, or support page rather than an error page.
- Archive status: retain the code record and its historical metrics, even after the active destination changes.
- Change log: record the date, old destination, new destination, reason, and approver for each update.
Avoid changing a destination mid-campaign in a way that mixes two unrelated offers under the same code. If the business objective changes materially, preserve the original code for reporting and create a new code for the new campaign.
Use a recurring reporting template
A weekly report is enough for many short campaigns; a monthly cadence may suit long-lived packaging or store signage. The goal is to make decisions, not create a dashboard no one reads.
Include these fields for each QR code or campaign variant:
- Campaign name and reporting period
- QR code name and owner
- Channel, location, audience, and creative version
- Distribution count or exposure estimate
- Total and unique scans
- Scan rate, with the denominator noted
- Landing-page visits and engagement signals, if tracked
- Primary conversions and conversion rate
- Qualified leads, sales, revenue, or gross profit
- Total campaign cost
- Cost per lead, cost per qualified lead, and cost per sale
- Baseline or control comparison
- Data-quality notes
- Recommended action: scale, revise, pause, or keep testing
A concise narrative makes the report usable. For example: “West-area postcards produced the most quote requests, but the poster generated the lowest cost per sale. Keep posters in place, test a stronger postcard offer in the next drop, and investigate why flyer form completion fell after the first landing-page field.”
Know the attribution limits
QR tracking improves visibility, but it does not make offline attribution perfect. Be transparent about what each metric represents.
Common limits include:
- One person may scan more than once or scan on one device and buy on another.
- A household may share a postcard, while only one recipient is counted in distribution.
- A shopper may scan a package insert but purchase through a marketplace or store without using a trackable offer.
- Poster exposure counts may be estimates rather than verified impressions.
- A visitor may remove UTM parameters, block analytics, decline consent, or complete a conversion later through another channel.
- Staff may fail to apply the appropriate in-store offer code.
- A QR code may be photographed, shared, or scanned outside its original placement.
These are reasons to use careful language—not reasons to abandon measurement. Report direct QR-attributed results alongside controlled comparisons, redemption data, CRM outcomes, and qualitative field feedback.
Improve data quality with operational discipline
Better data usually comes from stronger process rather than more dashboards.
- Create the campaign map before design work begins.
- Assign one owner to approve names, destinations, UTMs, and conversion definitions.
- Use a separate code whenever a channel, audience, location, or creative needs to be compared.
- Test the final code at its actual printed size and intended viewing distance.
- Ensure forms and checkout flows retain the campaign source.
- Train frontline teams to recognize campaign-specific offer or redemption codes.
- Reconcile QR scans, website conversions, CRM leads, and sales records on a fixed schedule.
- Log changes to destinations and landing pages so performance shifts can be explained.
- Keep historical codes and reports even after campaigns end.
Make offline ROI a repeatable system
The strongest QR code programs do not treat each flyer, mailer, poster, or insert as an isolated experiment. They use a shared taxonomy, comparable metrics, and a regular decision process.
QR Rapid can serve as the campaign-control layer for this workflow: create distinct dynamic QR codes for each offline variant, keep destinations editable when print is already in market, and organize tracking around the identifiers your marketing and operations teams use.
Start with one upcoming campaign. Create one code per channel, add consistent UTMs, define one primary conversion, record costs and distribution quantities, and schedule a report review before printing begins. Once that structure is in place, QR code campaign tracking becomes a practical way to decide what to repeat, what to revise, and what to stop funding.
FAQ
Should every flyer, postcard, poster, and package insert have a different QR code?
Use a different dynamic QR code for every channel you want to compare. Create additional codes for meaningful differences in location, audience, creative, or offer. Reusing one code across all placements prevents channel-level ROI analysis.
What is the difference between QR code scan rate and conversion rate?
Scan rate measures scans relative to distribution quantity or estimated exposure. Conversion rate measures completed actions relative to unique scans. A low scan rate can point to weak reach or appeal, while a low conversion rate usually points to a mismatch or friction after the scan.
Can UTM parameters track sales from a printed QR code?
UTMs identify the campaign source in website and analytics tools. To connect scans to sales, your form, booking system, ecommerce platform, or CRM must also record the conversion and preserve campaign details through the customer journey.
How do I measure ROI when customers scan a QR code but buy in a physical store?
Use a campaign-specific redemption code, claim flow, barcode, or staff-entered offer identifier at checkout. You can also compare exposed locations or customer groups with a control group, but describe the result as incremental performance rather than perfect one-to-one attribution.
What should happen when a QR code offer expires?
Do not leave scanners at an expired page or error screen. With a dynamic QR code, redirect the printed code to a current offer, relevant category page, store locator, or evergreen support page. Keep the original campaign record and metrics for historical reporting.
Which costs belong in QR code campaign ROI?
Include costs required to create and deploy the campaign, such as design, printing, postage, list rental, distribution, insertion fees, placement fees, and campaign-specific landing-page work. Apply the same cost definition to every channel comparison.
Similar Blogs
The latest industry news, interviews, technologies, and resources.
 September 14, 2026
How to Use QR Codes on Product Packaging for Customer Support and Reorders
How to Use QR Codes on Product Packaging for Customer Support and Reorders
Read post
 August 1, 2026
QR Codes for Lead Capture Forms: Turn Print Campaigns into Trackable Leads
QR Codes for Lead Capture Forms: Turn Print Campaigns into Trackable Leads
Read post


Join 2,000+ subscribers
Stay in the loop with everything you need to know.
We care about your data in our privacy policy